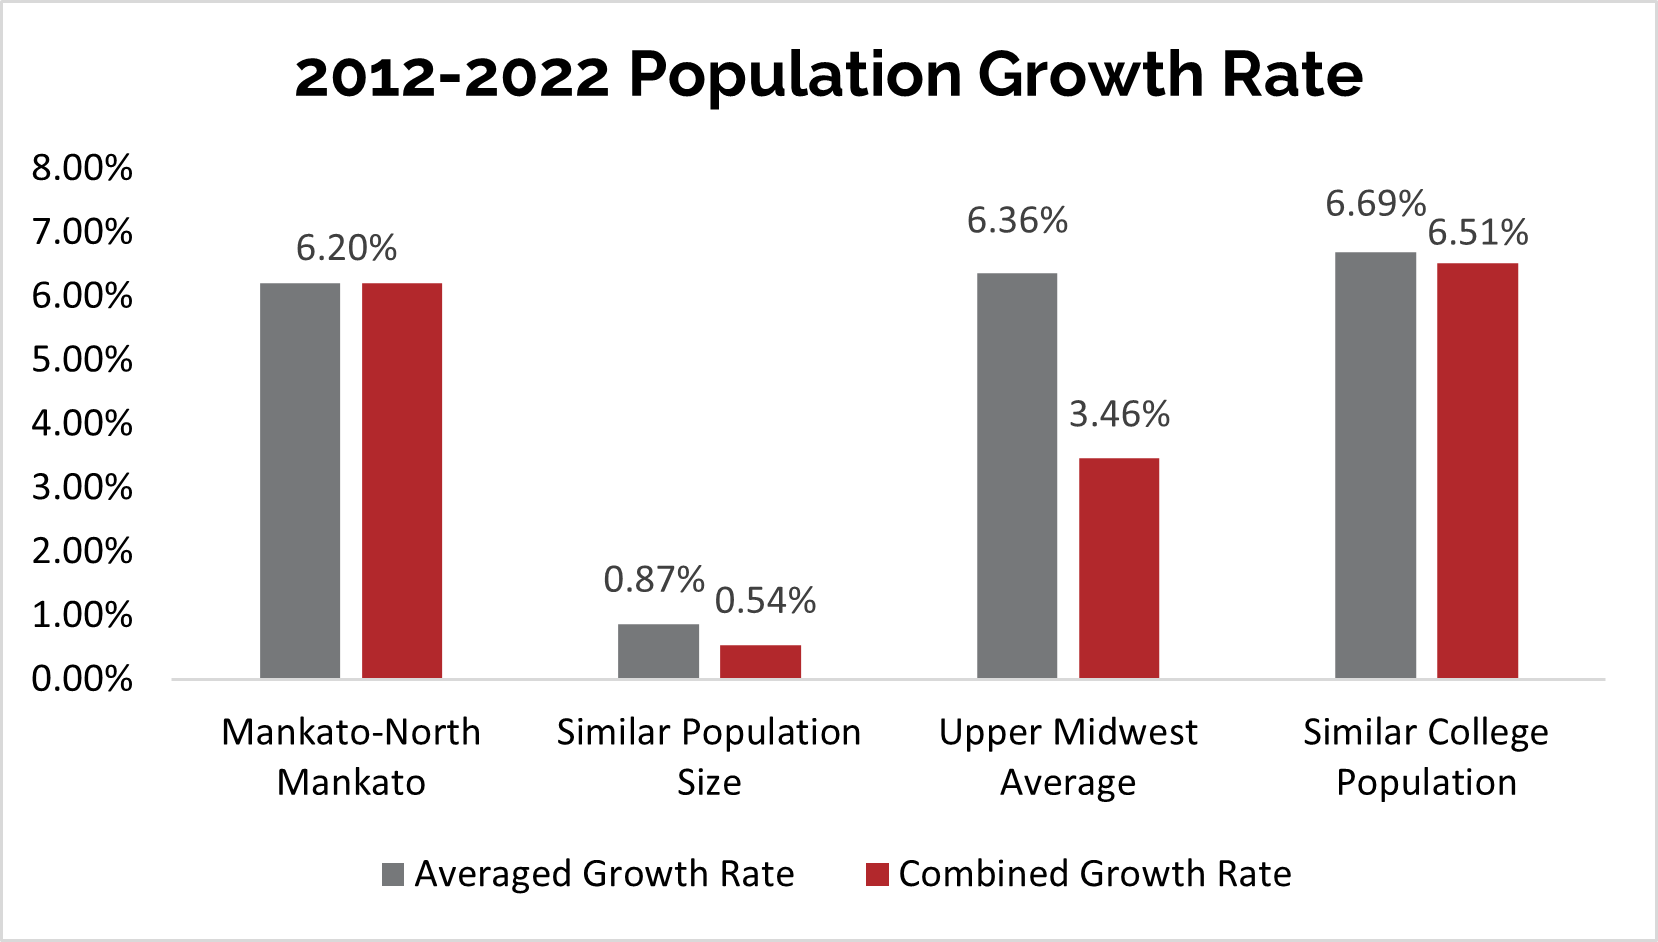
Population 2012-2022 Growth Rate
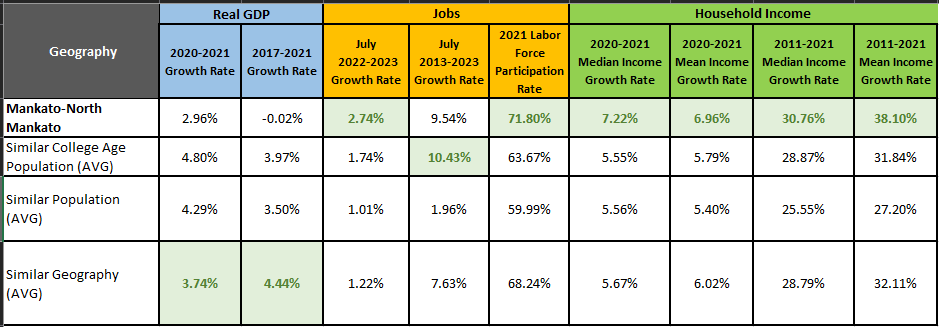
The Mankato-North Mankato ranks well when comparing our community to others with a similar population, communities with a similar college-aged population, and other communities across the Midwest.


The Mankato-North Mankato ranks well when comparing our community to others with a similar population, communities with a similar college-aged population, and other communities across the Midwest.